Educational tools
other
Top 5 Candlestick Trading Formations Every Trader Must Know
 ACY Securities
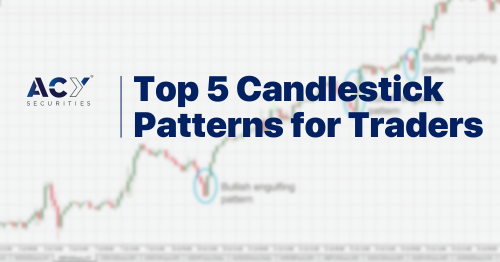
[](https://acy.com/en/)[](https://acy.com/en/campaign/anniversary)
Search Symbol
Trade
[Open an Account](https://acy.cloud/open-live-account?url=https%3A%2F%2Facy.com%2Fen%2Fmarket-news%2Feducation%2Ftop_5_candlestick_trading_formations_every_trader_should_know%2F&next=%2Fcreate-account%2Fselect-account-type&locale=en) Login
[](https://acy.com/en/)[](https://acy.com/en/campaign/anniversary)
click to search
Trade
open menu
[Home](https://acy.com/en/)
Trading
Products
Platforms
Trading Tools
[Partners](https://www.acypartners.com/)
Learn
News & Analysis
Support
Tim CahillSocceroos Legend & ACY Securities Global Brand Ambassador

[Explore More](https://acy.com/en/campaign/tim-cahill/)
# Top 5 Candlestick Trading Formations Every Trader Must Know
Ashley Jessen - Chief Operating Officer
2023-07-17 14:33:58
[](https://www.instagram.com/acy_securities/)[](https://www.linkedin.com/company/acysecurities/)[](https://www.youtube.com/channel/UCdyIX701mkb_QmVd1Atbxxw?sub_confirmation=1)[](https://twitter.com/ACY_Securities)[](https://www.facebook.com/acy.securities)
Steve Nison is considered the Godfather of candlesticks, and every trader who loves candlestick patterns must read at least one of his outstanding books.
In this article, we'll dive into the top 5 candlestick trading formations every trader must know, so you can set a rock-solid foundation for your entries and exits.
Candlesticks are a great way for traders to visualise specific price patterns on charts.
They help traders make better trading decisions about where and when to enter and exit the markets, as well as where best to set their stop-loss and take-profit levels.
### Candlestick trading formations are used to identify situations where:
1. The trend is about to reverse - reversal candlestick patterns.
2. The trend is about to accelerate in the same direction after a short consolidation - continuation patterns.
3. There is no real trend, as neither buyers nor sellers are in control – indecision patterns.
Candlesticks are a common form of technical analysis and nearly all charting platforms default to a candlestick chart, such as [MT4](https://acy.com/en/platforms/mt4).
### Candlestick charting basics
A candle is formed by a body and wicks.
The body is the solid area between the open price and the close price, and the wicks represent the highest and the lowest levels during the timeframe used.
The size of the body can give clues to traders about the strength of the movement, and the wicks help give an idea as to volatility.
Now you have the basics of Japanese candlestick charts and what they represent, let’s have a look at five of the most widely used candlestick patterns.
Whether you’re a beginner trader or someone who has been in the markets for a long time, you will regularly encounter these powerful candlesticks patterns.
### Top 5 candlestick formations every trader should know
### 1\. Doji candlestick pattern
A doji happens when the opening and closing prices are (almost) the same, which often results in a straight line as a body.
It shows that buyers and sellers are undecided about the direction in which the asset should evolve. Whether you’re trading [forex](https://acy.com/en/products/forex), [CFDs](https://acy.com/en/products), [Indices](https://acy.com/en/products/indices), [Commodities](https://acy.com/en/products/commodities) or Cryptocurrencies, doji candles can show up at times of indecision in the markets.
This pattern is the strongest indecision candlestick pattern, as no market participant (buyers or sellers) is in control.
You can see in the chart below several doji candlestick patterns.
#### How to trade the doji candlestick pattern:
Since a doji is considered a indecision period, your strategy here is to be on high alert for a potential change in direction of trend.
A lot of times a doji will indicate a potential change of direction.
When you see a doji candlestick pattern, consider tightening your stops or exit on a confirmation of the next candle breaking lower.
Or for those looking to enter on this candlestick pattern with a bullish view, consider putting your stop entry order above the high of the current doji, once again confirming the direction or breakout.
You can find different types of dojis, depending on the length of the upper and lower wicks:
- The “regular doji”
- The gravestone doji
- The long-legged doji
- The four price doji
- And the dragon-fly doji.
With dojis, traders know that sentiment is likely to change.
They are waiting for either the bulls or the bears to take control and push prices higher or lower. Be patient and wait for a confirmation of direction.
### 2\. Bearish & Bullish engulfing pattern
A bearish engulfing pattern represents a major bearish reversal pattern that is composed of two candlesticks that appear after an uptrend. The second candle is always bigger than the previous one, engulfing it.
Here is what you need to monitor to be sure that this pattern is valid:
- This pattern has to appear after an uptrend.
- The body of the 2nd candlestick must “swallow” the body of the first candle (not necessarily with the wicks).
- The 1st candlestick should usually be bullish, while the second one should be a bearish candle.
- The wicks of the 2nd candle should be short, showing there is little volatility, and the movement is strong.
A bearish engulfing pattern can only appear after an uptrend.
With a bearish engulfing pattern, the 1st candle is bullish, and prices increase on the following day. The instrument opens higher compared to the closing price of the previous day.
However, the bulls aren’t strong enough, and sellers take control by pushing prices down, so then prices finally close below the opening of the previous day.
The gains of the previous day are erased, which shows a bearish force has taken over.
A bullish engulfing pattern is the same as the bearish engulfing pattern but in the opposite direction and is one of the best candlestick patterns for day trading.
You will notice the green candle completely engulfs the previous bearish candle.
This is a bullish sign with the bulls in complete control and dominating the bears and one of the most popular forex candle formations.
Bullish reversals like the three shown on the [GBPUSD](https://acy.com/en/market/gbpusd/) chart below are a popular signal for traders looking to identify early turning points in the market.
#### How to trade the bullish engulfing candlestick pattern:
This powerful reversal pattern occurs after a downtrend, signalling a shift in market sentiment from bearish to bullish.
To effectively trade the Bullish Engulfing pattern, first ensure it appears after a sustained downward movement.
The first candlestick should be bearish, followed by a second candlestick that
This brief was generated from the original reporting. Read the full article at the source:
Read at acy.com